Exploring Trends in Data Set
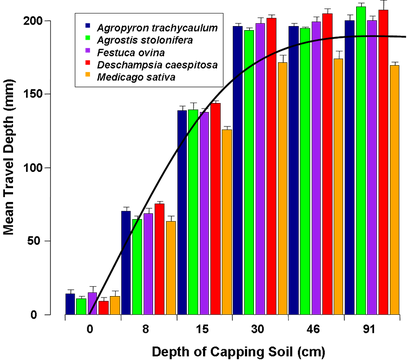
Figure1: Bar plot of mean travel depth as a function of capping soil treatment.
As the bar plot suggests, the mean travel depth is influenced in two regards. The first is that the depth of capping soil, or soil treatment, is influencing the degree of water infiltration and migration. To exemplify this point let us examine treatments 0 cm through 30 cm. The mean travel depths for each of these treatments are approximately linear, inferring that as soil depth increases, so does the depth of infiltrating water. Intuitively this would suggest that the phosphogypsum material that underlies each treatment is creating a barrier for water. As the depth to reach the interface increases so too does the depth of infiltration. However, the three greatest treatments (30, 46 and 91 cm) appear not to be influencing the migrations of water, suggesting that there is a limit to the amount of soil needed to influence the infiltration process.
The movement of water is not only influenced by capping depth of topsoil, but plant species as well. While most plant species tested here are grasses, Medicago sativa (Alfalfa) is not. This particular plant is a tap-rooted perennial species that is known to penetrate deep into the soil profile. However, as both plots highlight, the influence of Medicago sativa on water migration is only evident in soil treatments 15, 30, 46 and 91 cm.
The movement of water is not only influenced by capping depth of topsoil, but plant species as well. While most plant species tested here are grasses, Medicago sativa (Alfalfa) is not. This particular plant is a tap-rooted perennial species that is known to penetrate deep into the soil profile. However, as both plots highlight, the influence of Medicago sativa on water migration is only evident in soil treatments 15, 30, 46 and 91 cm.
Exploring Distributions in Data Set
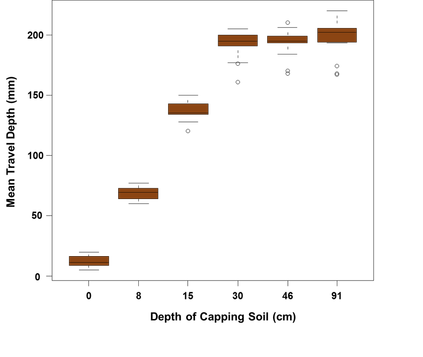
Figure 2: Boxplot of mean travel depths as a function of soil treatment.
The distribution of the mean travel depth as a function of soil depth is relative to each treatment. For example, the 8 cm treatment appears to be normally distributed with no outliers. In contrast the 30 cm treatment appears to be skewed in distribution with two outliers. The rationale for this observation has to do with the influence of plant species on the mean travel depths. As discussed in the previous section, the Medicago sativa species does influence the mean travel depths, but only at instances when the amount of topsoil present exceeds a particular depth. Beyond the individual distribution that is observed, the overarching trend is still present concerning the mean travel depth as a function of capping soil depth as discussed in the previous section.
Exploring Normality in Data Set
|
To assess the normality of the data set the residuals were plotted as a factor of each treatment. This plot is unique as such because this distribution describes the residuals in relation to the mean of each treatment, and not the entire data set. The rationale for this particular statistical parameter is simply due to the non-linear relationship between the soil depth and the mean travel time.
The distribution as described by both the histogram (Figure: 4) and the residual plot (Figure: 5) is such that the each soil treatment is normally distributed and not the entire data set as a whole. |
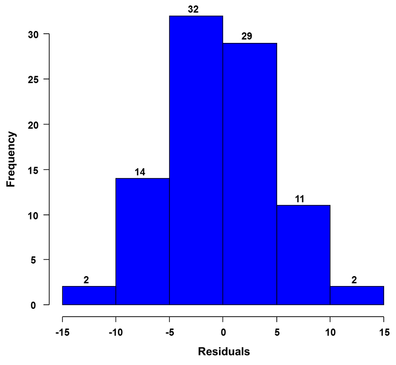 Figure 4: Histogram of residuals 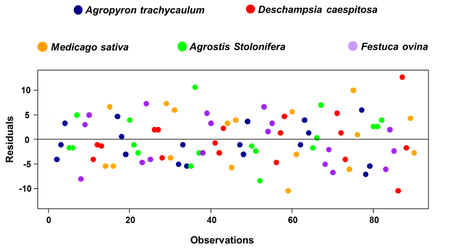 Figure 5: Residual plot of data set |
Disclaimer: All datasets, events and parameters have been manipulated and generated.
