ANOVA
The graphical representations of the data set from the previous section showcased two main features. The first attribute is the overall exponential trend of the mean travel depth with respect to capping depth of soil. The second feature is the overall difference in mean travel depth with respect to the various plant species.
The result of a simple analysis of variance (ANOVA) for mean travel depth as a function of soil capping depth and mean travel depth as a function of plant species yielded p-values of 2.2E-16 and 7.44E-15 respectively. This result infers that there is a significant difference in mean travel depth as a response to soil capping depth and as a response to plant species. However, this result does not indicate the significance of each treatment level combination.
The result of a simple analysis of variance (ANOVA) for mean travel depth as a function of soil capping depth and mean travel depth as a function of plant species yielded p-values of 2.2E-16 and 7.44E-15 respectively. This result infers that there is a significant difference in mean travel depth as a response to soil capping depth and as a response to plant species. However, this result does not indicate the significance of each treatment level combination.
Tukey Honestly Significant Difference Test
Table 1 below highlights the p-values of a Tukey honest significance test that was run over the entire data set. The summarized values represent the interaction between the various plant species with respect to an individual soil capping treatment. From Table 1 the red highlighted p-values are the interactions that are significantly different. At a significance level of 0.05 it is apparent that the mean travel depths of the subplots that are seeded to Medicago sativa (alfalfa) are different from all other plant species.
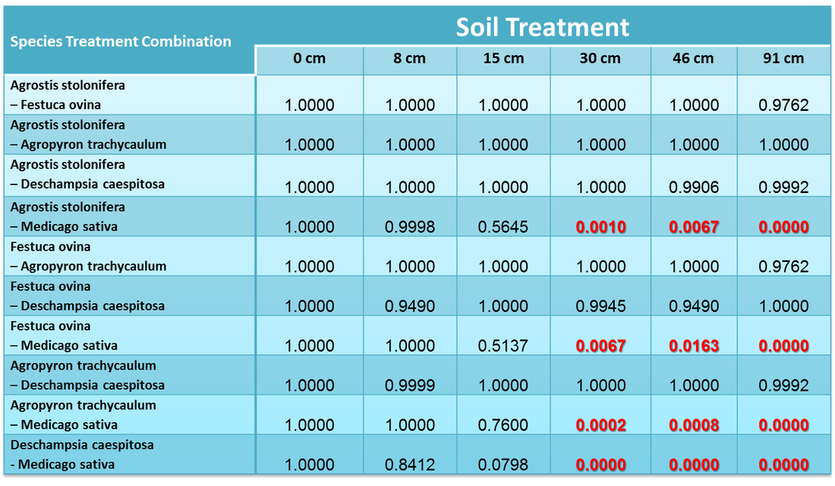
Table 1: Tukey honestly significant difference test results for plant species as a factor of soil treatments
Table 2 highlights the p-values of a Tukey honest significance test that was run over the entire data set. The summarized values represent the interaction between the various capping depth treatments with respect to the individual plant species. From Table 2 the red highlighted p-values indicate the interactions that are NOT significantly different. At a significance level of 0.05 it is apparent that the mean travel depths of the subplots that have been reclaimed with 0, 8 and 15 cm of topsoil are significantly different from all other soil treatments across all plant species. However, the mean travel depths pertaining to the subplots that have been reclaimed with 30, 46, and 91 cm of topsoil do not show a significant difference with respect to each other.
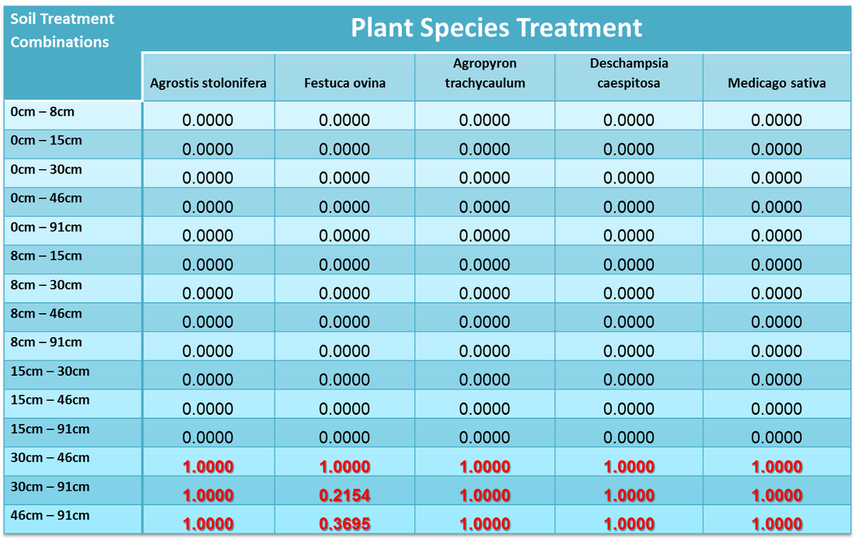
Table 1: Tukey honestly significant difference test results for soil treatments as a factor of plant species.
Regression Analysis
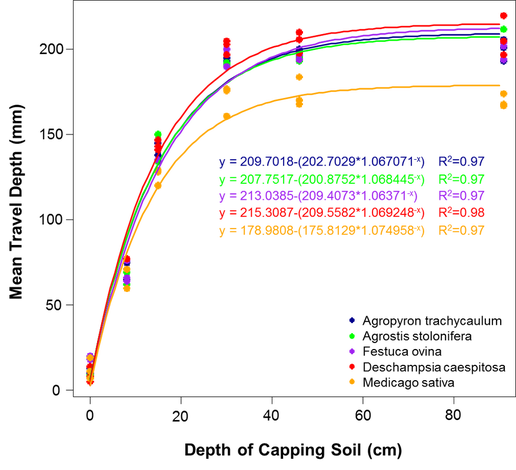
Figure 1: Regresion analysis of raw data set
The general relationship between mean travel depth and soil capping treatment follows an exponential equation in the form of Y = a – (b*c-x), where Y is the mean travel depth, X is the soil treatment level and a, b and c are graphical parameters. Each of the plant species is fit to its own curve which describes the relationship between the mean travel depth and soil capping treatment. These equations answer the question: If we place X-amount of topsoil on phosphogypsum, what will the mean travel depth, given a specific plant species established, be? However, if we are indeed investigating the ideal amount of topsoil needed to limit the amount of water percolation into the phosphogypsum material then we need to assess the maximum mean travel depth and work backwards. For example, if we use the Agropyron model to predict the maximum mean travel depth, we acquire a value of 209 mm. From this, we can then assume that 30cm of topsoil would be a sufficient amount of topsoil.
Disclaimer: All datasets, events and parameters have been manipulated and/or randomly generated.
