Experimental Design
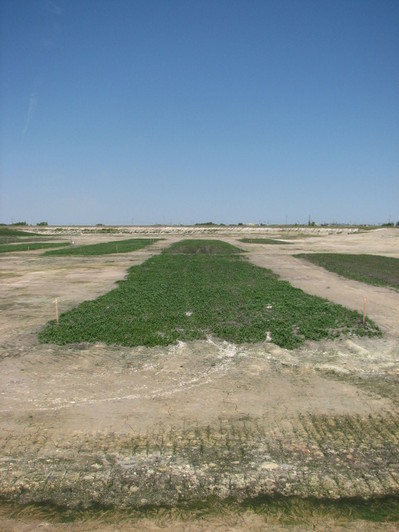
The experimental plots are located atop a decommission phosphogypsum (PG) stack at the Agrium Nitrogen Operation facility in Fort Saskatchewan, Alberta (Figure 1). The plots are arranged into 3 replicates. Each replicate is composed of six soil depth treatments including 0, 8, 15, 30, 46, and 91 cm. In addition, each treatment is subdivided into five subplots that contain five different plant species including Agrostis stolonifera, Agropyron trachycaulum, Deschampsia caespitosa, Festuca ovina and Medicago sativa (Figure 2).
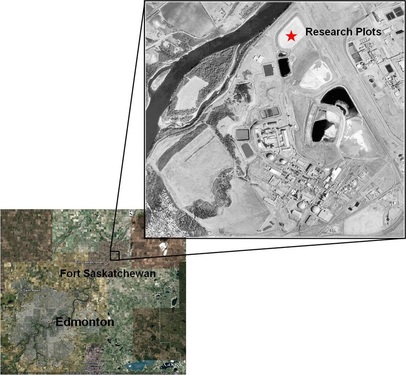 Figure 1: Research plot location |
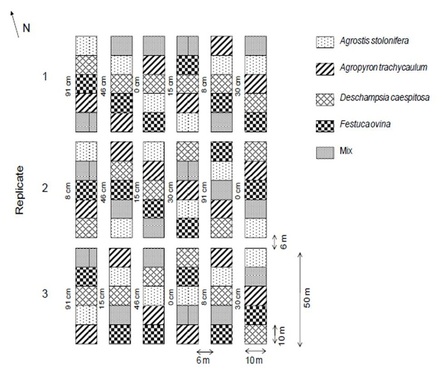 Figure 2: Experimental research plots |
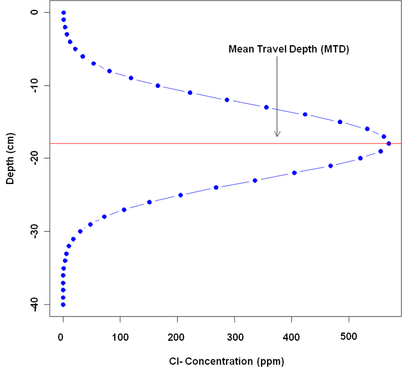
Figure 3: Breakthrough curve for TMT 30cm, Agropyron trachcaulum.
In order to quantify the movement of water in each subplot, a conservative tracer, potassium chloride (KCl), was applied. As the tracer dissolves into the soil water, the anion (Cl-) migrates with the advective flow of the pore water. After one year under natural field conditions, 100cm cores were taken from each subplot sectioned into 2.5 cm increments and analyzed for chloride (Cl-). Graphical analysis yields a complete breakthrough curve for each subplot core that highlights the distribution of chloride in the soil profile (Figure 3). From this distribution, a mean value can be calculated to describe the depth to which the advective front of the migrating water has reached. This value is referred to as the mean travel depth and will be represented as a singular value for each subplot sample. Once all cores have been analyzed the mean travel depths for each subplot is tabulated with respect to plant species and topsoil treatment (Table1).
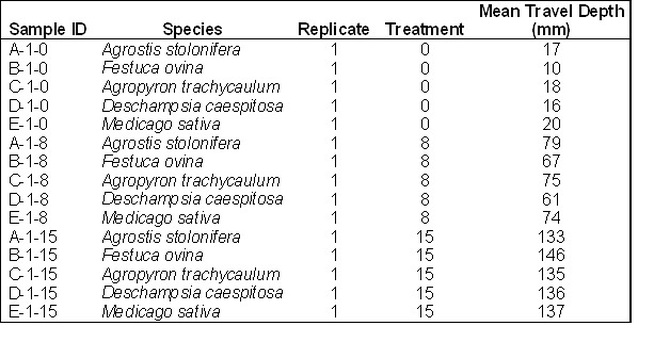
Table 1: Sample table of data set
Parameters / Variables
This experiment has been established to quantify the effects of topsoil capping depths and plant species on water movement within the topsoil cap and possibly the underlying phosphogypsum material. With that regard, the predictor variables include both the depth of topsoil cover measured in cm of soil and the type of plant species present. The response variable for this experiment is simply the mean travel depth of the conservative tracer in the anthropogenic soil profile, measured in mm. Climatic variability has not been manipulated in order to replicate natural transient conditions.
Statistical Analysis
In order to assess the impact of capping depth on the movement of water in the soil profile we must first visually compare the treatments by means of boxplots and bar charts. Use of each of these methods will give insight into the overall trends of the data set as well as the distribution of the data set. To further test the normality and equality of variance a residual plot will be developed with each treatment level subdivided as a factor of plant species.
To evaluate the probability that the mean travel depth for each soil capping treatment is not equal an analysis of variance (ANOVA) will be conducted. This evaluation will only be used to describe the probability of similarity between treatments; however, to elaborate on the significance of each mean travel depth as a function of capping depth and plant species an Tukey’s honest significant difference test will be administered. This test will answer the question of whether or not plant species and capping depth have a significant effect on the mean travel depth of water in the soil profile.
Finally, a regression equation will be fitted to each species to describe the overall relationship between capping soil depth and mean travel depth.
Disclaimer: All datasets, events and parameters have been manipulated and/or randomly generated.
